FMP
Which ratios measure financial liquidity and how are these ratios calculated?
Sep 30, 2022 5:04 AM - Jack Dalton


Image credit: Manik Roy
The world of finance can feel like a black box. The industry is full of complicated sounding ratios and grandeur terms. However, once you understand the core principles, learn how to calculate the ratios, and how to use ratios it becomes a lot less complicated. In this article, we will go over each ratio and discuss the following:
1. The definition of the ratio and why it's important
2. How to calculate the ratio
3. How to find the right information in the balance sheet
Before we dive into the liquidity ratios, read the first article in the series if you need to brush up on exactly what financial liquidity means.
1. Current Ratio
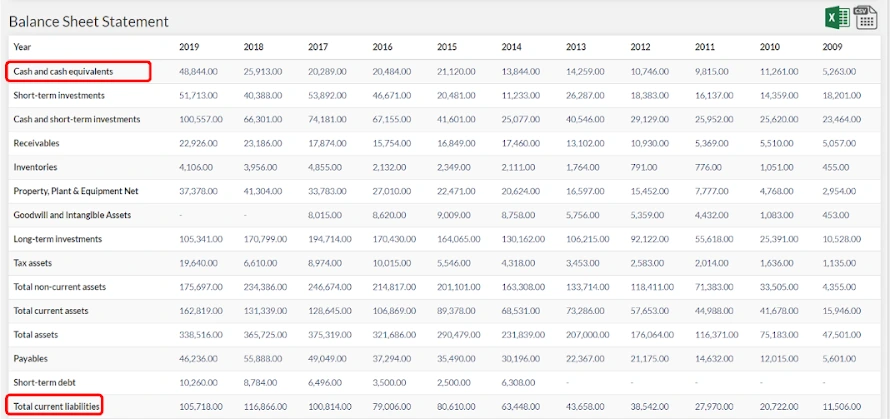
The current ratio looks at a firm's ability to pay off its short term financial obligations. These are all liabilities and debts that must be paid within a year. On the balance sheet, these can be found by looking at the Current Liabilities. This is made up of accounts payable, short-term debt, and others. Given that the current liabilities must be paid within a year, it's natural then that we should compare this against assets that can be liquidated within a year to pay for them. The value of these assets can be found by looking at the Current Assets within the balance sheet. Current Assets are made up of Cash & Cash Equivalents, Short-Term Investments, Receivables, Inventories, and others. As shown in the equation below, the Current Ratio is found by dividing the Current Assets by the Current Liabilities. A current ratio of 1.0 or greater is an indication that the company is well-positioned to cover its current or short-term liabilities. Less than 1 indicates that the firm may struggle to stay afloat, particularly if business takes a downturn (COVID-19…). An important practice for all ratio analysis is to compare the company's ratio to the industry average. Always do deeper research into a company that deviates from the industry average; deviation could be good or bad depending on that specific situation.
Equation: Current Ratio = Current Assets / Current Liabilities

2. Quick Ratio
The Quick ratio (often referred to as the Acid-Test Ratio) is more conservative than the current ratio because it excludes inventory and other current assets, which are generally more difficult to turn into cash. When we think about liquidity as being how easy it is to turn an asset into cash at market value this makes sense. Say Apple has a hundred million dollars worth of the latest iPhone stashed in inventory and a significant demand reduction is induced by an economic downturn. This inventory will be harder to sell at the market price, meaning they would have to offer discounts if they need the cash to pay off some short term debt. One thing to look out for is the percentage of Receivables that make up the assets. A high percentage of receivables leaves a firm vulnerable to their customers not being able to pay them or not being able to pay them in a timely fashion. The Cash Ratio enables you to analyze the worst case situation. As with the Current Ratio, a higher quick ratio means a more liquid current position. Generally, a healthy company has a current ratio around 1.0.
Equation: Quick Ratio = (CashandCashEquivalents+ShortTermInvestments+AccountReceivables) / Current Liabilities

3. Cash Ratio
The cash ratio is almost like an indicator of a firm's value under the worst-case scenario where the company is about to go out of business. This ratio looks at how able a firm is able to pay off debts with cash and cash equivalents such as marketable securities. Naturally, this is the most conservative liquidity ratio that is commonly used. Clearly, a cash ratio of 1 indicates that a firm is able to cover all short term liabilities if they became due tomorrow. However, looking at this ratio in isolation is often unhelpful. A better practice is to compare it to the industry average. A cash ratio higher than industry average suggests that the firm is underutilizing cash. Often it is better to invest cash in something that produces a higher return or pay out larger dividends to shareholders. A lower than average Cash ratio is arguably more concerning as it indicates misuse of cash. Either way, an irregular Cash ratio should be investigated further to determine the cause.
Equation: Cash Ratio = Cash & Cash Equivalents / Current Liabilities
4. Days of Sales Outstanding (DSO)
DSO tells you how many days after the sale it takes people to pay you on average. In the equation below, it looks at this over a year long period but this can also be applied to a month or quarter by looking at the start and end receivables of the period and dividing it by the number of days in that period. DSO only looks at sales made on credit because we only take receivables into account. Cash sales have a DSO of 0 (the cash is received upon sale) and so are omitted from the calculation. A high DSO tells us that customers are taking more time to pay and the company is making more sales on credit. Naturally, any sales on credit are a higher risk due to the uncertainty of payment, and, additionally, higher DSO means that the company cannot quickly use the cash earned to turn into more future revenue. Generally, 45 days is considered a low DSO, but, as with all ratios, to truly understand if the DSO of a company is good you must also compare it against similar businesses with comparable structures.
Equation: DSO = ((AccountReceivable(start) + AccountReceivable(end)) / 2) / (Revenue / 365)

5. Days of Inventory Outstanding (DIO)
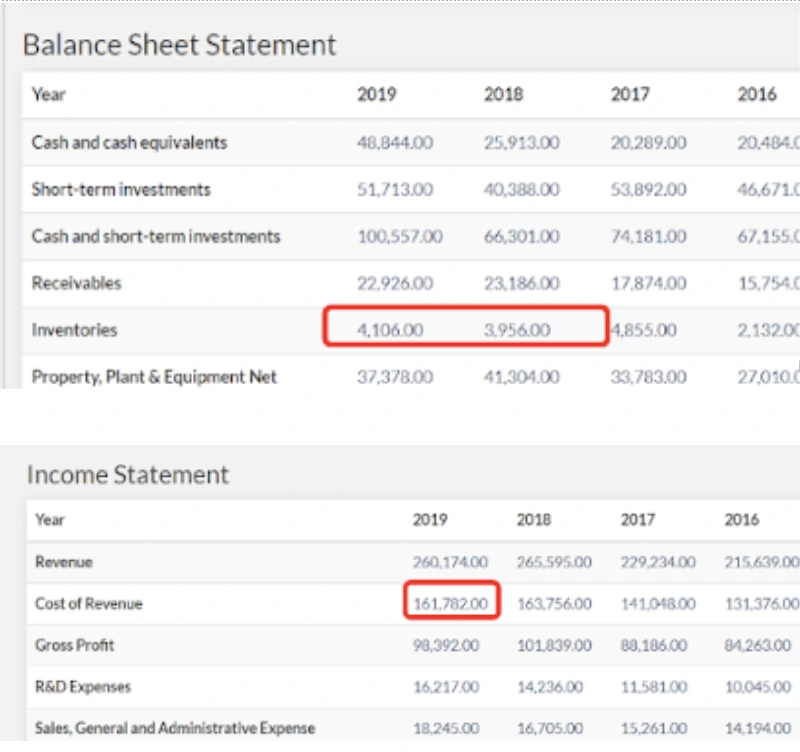
DIO tells you how many days inventory sits on the shelf on average. It is otherwise known as the Average Age of Inventory measuring how long it takes to turn inventory (goods and work in progress) into a sale. Essentially, DIO measures the liquidity of a firm's inventory. Though you want to look at industry averages, you can be safe in assuming that a lower DIO is a good thing. A high DIO (or a DIO that is constantly increasing over time) is cause for concern. It indicates that either demand is low or the firm is overproducing, and both of these would be a worry.
Equation: DIO = ((Inventories(start) + Inventories(end)) / 2) / (COGS / 365)
6. Operating Cycle
Basically the Operating Cycle tells you how many days it takes for something to go from first being in inventory to receiving the cash after the sale. You calculate the operating cycle by adding DSO and DIO together. Though this is a useful ratio, it's better to understand days of payables outstanding and then calculate the Cash Conversion Cycle which is the last ratio we explore in this article.
Equation: Operating Cycle = DSO +DIO
7. Days of Payables Outstanding (DPO)
DPO tells you how many days the company takes to pay its suppliers. You may be inclined to think that a high DPO is a bad thing. This is not always the case. Having a high DPO could mean that the company is delaying cash payments in order to make greater revenues and more easily pay bills and invoices down the road. It improves the optics of the companies overall liquidity because a higher DPO means a reduced Cash Conversion Cycle. However, a high DPO could also jeopardize the relationships a company has with suppliers and creditors, as well as missing out on discounts offered if a company pays invoices in a timely fashion. It's important for companies to carefully consider how they treat their payables and you should investigate comments in financial statements to see why a company is making decisions about payables.
Equation: DPO = ((AccountsPayable(start) + AccountsPayable(end)) / 2) / (COGS / 365)

8. Cash Conversion Cycle (CCC)
The cash conversion cycle (CCC) measures the number of days a company's cash is tied up in the production and sales process of its operations and the benefit it derives from payment terms from its creditors. The shorter this cycle, the more liquid the company's working capital position is. The CCC is also known as the "cash" or "operating" cycle. This ratio combines DSO, DIO, and subtracts DPO. It is one of the best measures of cash flow management and an indicator of a firm's financial strategy.
Equation: Cash Conversion Cycle = DSO +DIO -DPO
Rounding Up
The liquidity ratios we discussed in this article will enable you to learn how well placed a company is to be able to pay off its debts and it gives you a perspective as to how a company manages its cash and debt. Financial Modeling prep gives you the most up to date ratios for all listed companies but more importantly gives you access to downloadable financial statements so you can perform your own calculations. We recommend downloading a few financial statements from some companies you are interested in and calculating their liquidity ratios. Here is a link to Apple's Financial Statements to get you going!
Other Blogs
Sep 11, 2023 1:38 PM - Rajnish Katharotiya
P/E Ratios Using Normalized Earnings
Price to Earnings is one of the key metrics use to value companies using multiples. The P/E ratio and other multiples are relative valuation metrics and they cannot be looked at in isolation. One of the problems with the P/E metric is the fact that if we are in the peak of a business cycle, earni...

Sep 11, 2023 1:49 PM - Rajnish Katharotiya
What is Price To Earnings Ratio and How to Calculate it using Python
Price-to-Earnings ratio is a relative valuation tool. It is used by investors to find great companies at low prices. In this post, we will build a Python script to calculate Price Earnings Ratio for comparable companies. Photo by Skitterphoto on Pexels Price Earnings Ratio and Comparable Compa...

Oct 17, 2023 3:09 PM - Davit Kirakosyan
VMware Stock Drops 12% as China May Hold Up the Broadcom Acquisition
Shares of VMware (NYSE:VMW) witnessed a sharp drop of 12% intra-day today due to rising concerns about China's review of the company's significant sale deal to Broadcom. Consequently, Broadcom's shares also saw a dip of around 4%. Even though there aren’t any apparent problems with the proposed solu...