FMP
Which ratios measure profitability and how are they calculated?
Sep 30, 2022 5:01 AM - Jack Dalton


Image credit: Frank Busch
In the last article we looked at the difference between profit and profitability. We learned that profitability is a measure of relative profit; how much profit is made compared to total revenue.In this article, we will explain the ratios that measure profitability, how to calculate them, and where to find the right information. The ratios we will be looking at are:
1. Gross Profit Margin
2. Operating Profit Margin
3. Pretax Profit Margin
4. Net Profit Margin
5. Return on Assets
6. Return on Equity
7. Return on Capital Employed
If you haven't already read our article about profitability and what makes it more important than profit . Give it a quick read to brush up on your knowledge of profitability before we dive into these ratios.
1. Gross Profit Margin
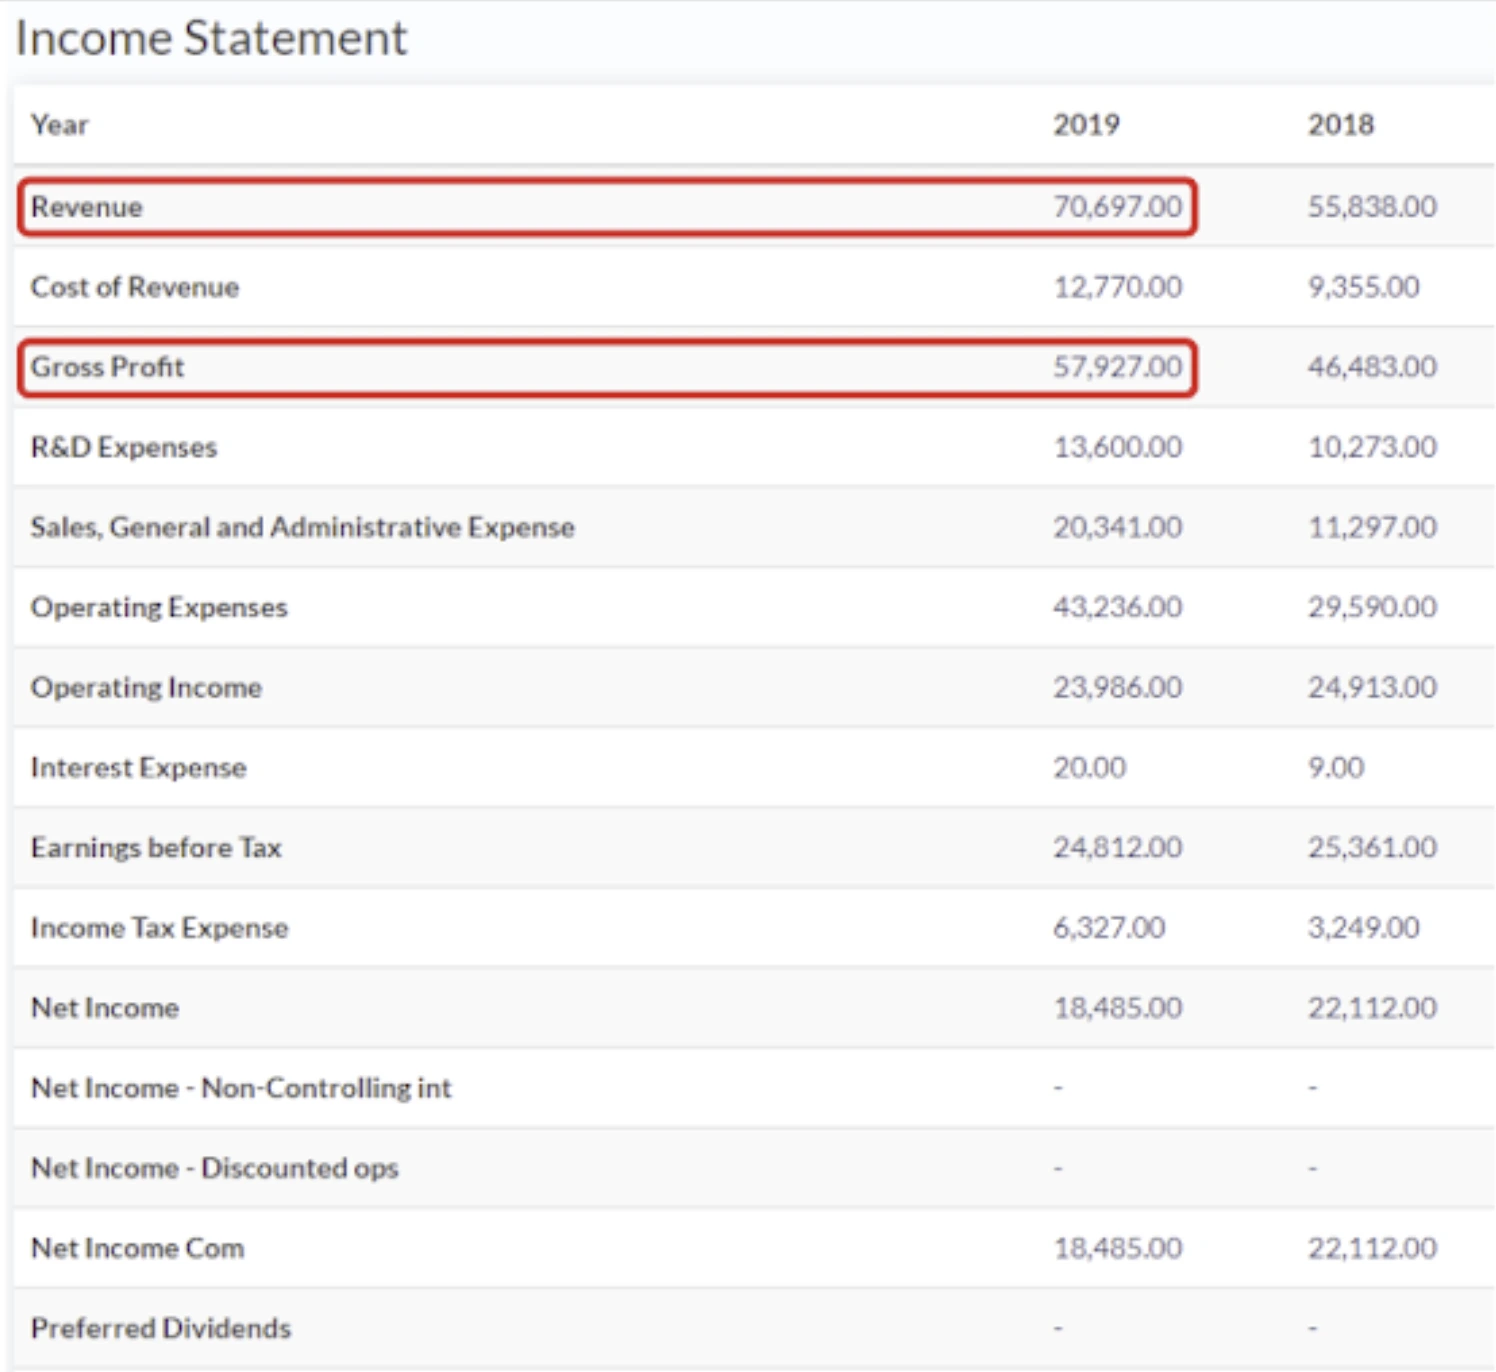
You can think of it as the amount of money from product sales left over after all of the direct costs associated with manufacturing the product have been paid. Gross profit is calculated by subtracting Cost Of Goods Sold (All the variable costs including direct labour, materials, packaging, and others) from Revenue. Luckily Income Statements show gross profit on them so you won't have to calculate it. Gross profit margin tells us how efficient management has been in generating revenue given the costs associated with producing/delivering products or services. A ‘good' gross profit margin is determined by looking at industry averages of comparably sized companies; this applies to almost every financial ratio that you may use.
Equation: Gross Profit Margin = Gross Profit / Revenue
Where can you find these numbers? Here's an example using Facebook's income statement:
2. Operating Profit Margin
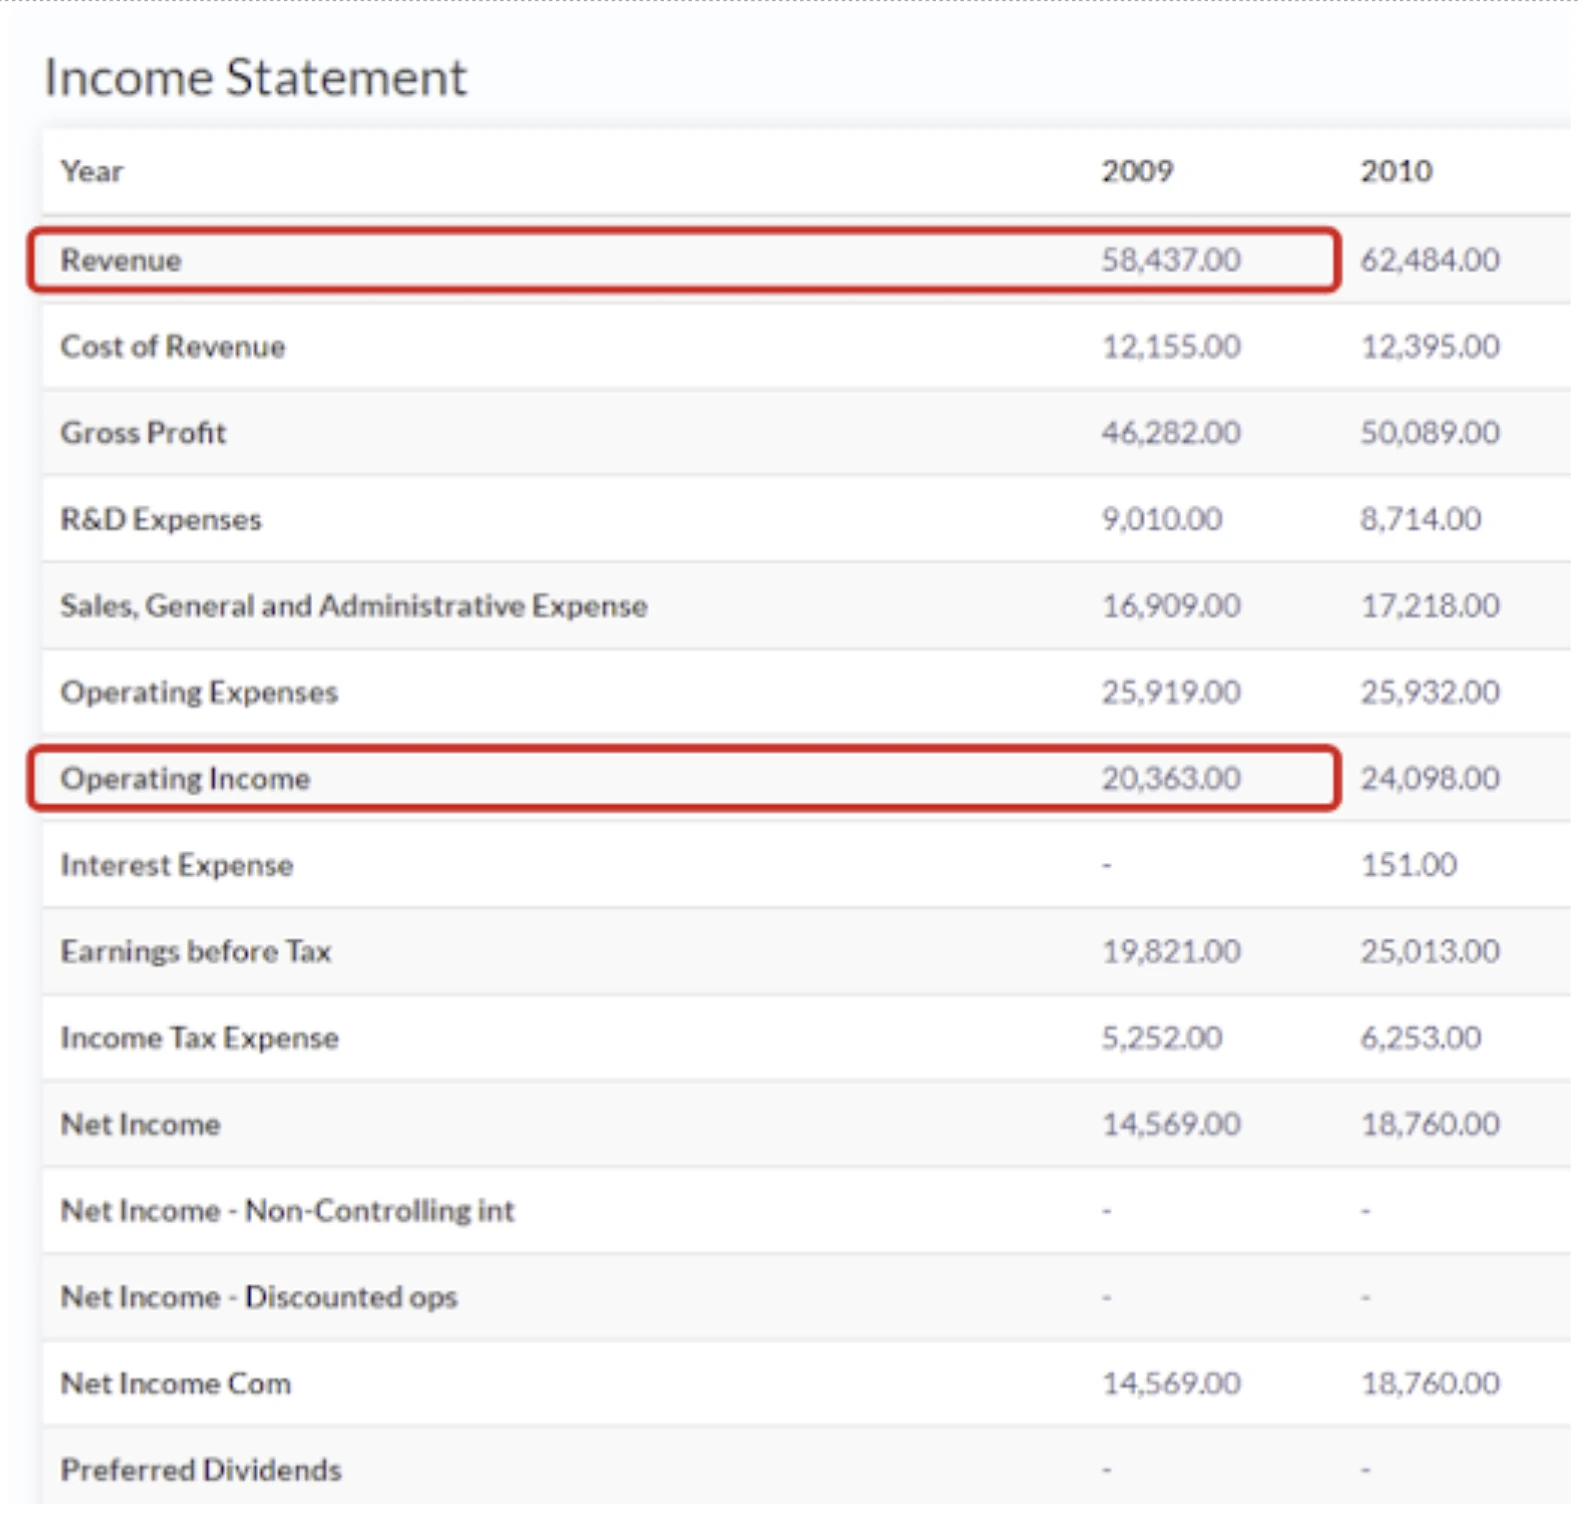
If companies can make enough money from their operations to support the business, the company is usually considered more stable. The operating profit margin shows the percentage of profit made before deducting taxes and interest charges. Operating profit or income is calculated by subtracting all COGS, amortization, depreciation, and operating expenses from revenue. Relevant operating expenses include PPE (Property, plant and equipment), salaries & bonuses, R&D costs, and others. Many argue that the operating profit margin is the best ratio for determining management effectiveness, because it shows all the costs which they can control are represented. For example, whether or not certain salaries are too high, or the office being rented is too expensive given how much work is done there (as remote work becomes more popular this will become more common).
Equation: Operating Profit Margin = Operating Income / Revenue
Where can I find these numbers? Here's an example using Microsoft's Income Statement
3. Pretax Profit Margin
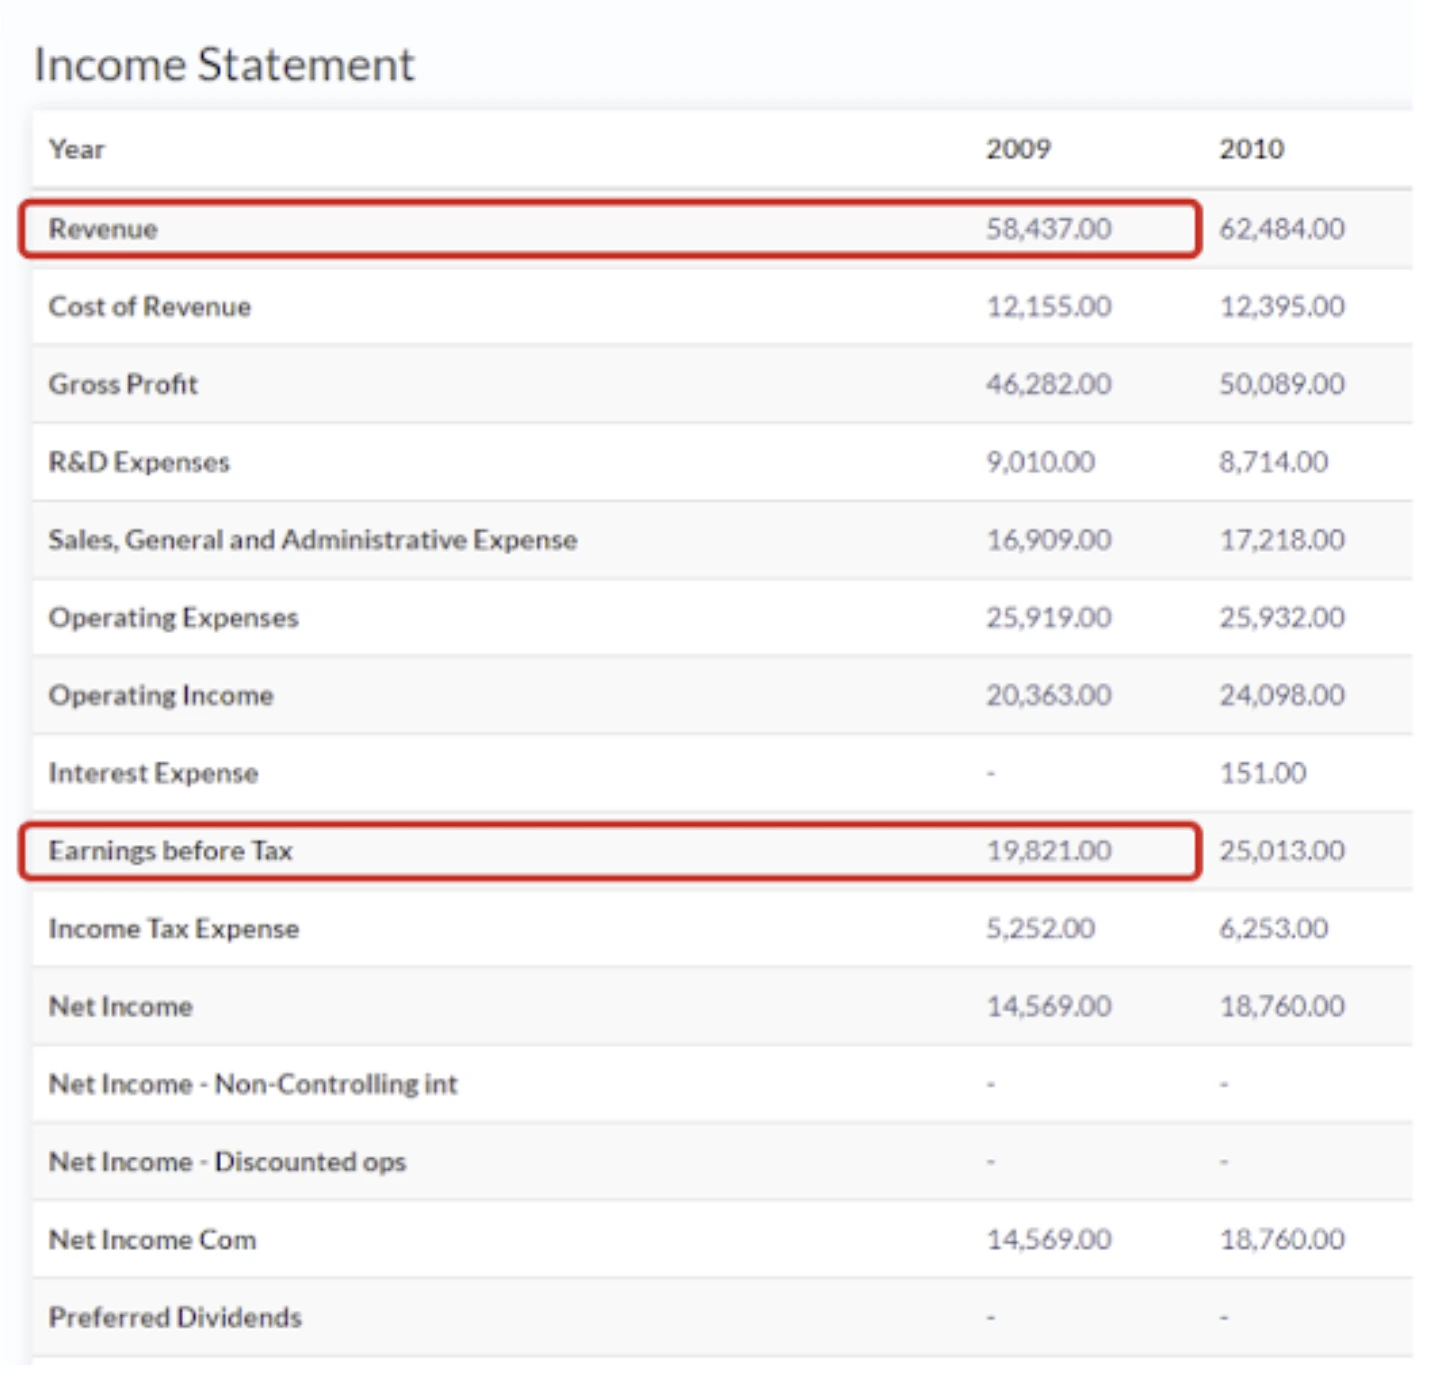
As with all of these ratios, pretax profit margin gives us insight into the profitability of a company. As the name suggests, pretax profit margin shows us how profitable a firm is before taxes are deducted. This is often a better measure than net profit margin because tax rates vary considerably between cities, states, and nations, and this is usually out of the control of management. In comparison to operating profit margin, interest expense is deducted from the earnings. Interest expense is more controllable by management than taxes since management (namely the CFO) regulate how much debt the company has.
Equation: Pretax Profit Margin = Earnings Before Tax / Revenue
Where can you find these numbers? The image shows you using Microsoft's Income Statement:
4. Net Profit Margin
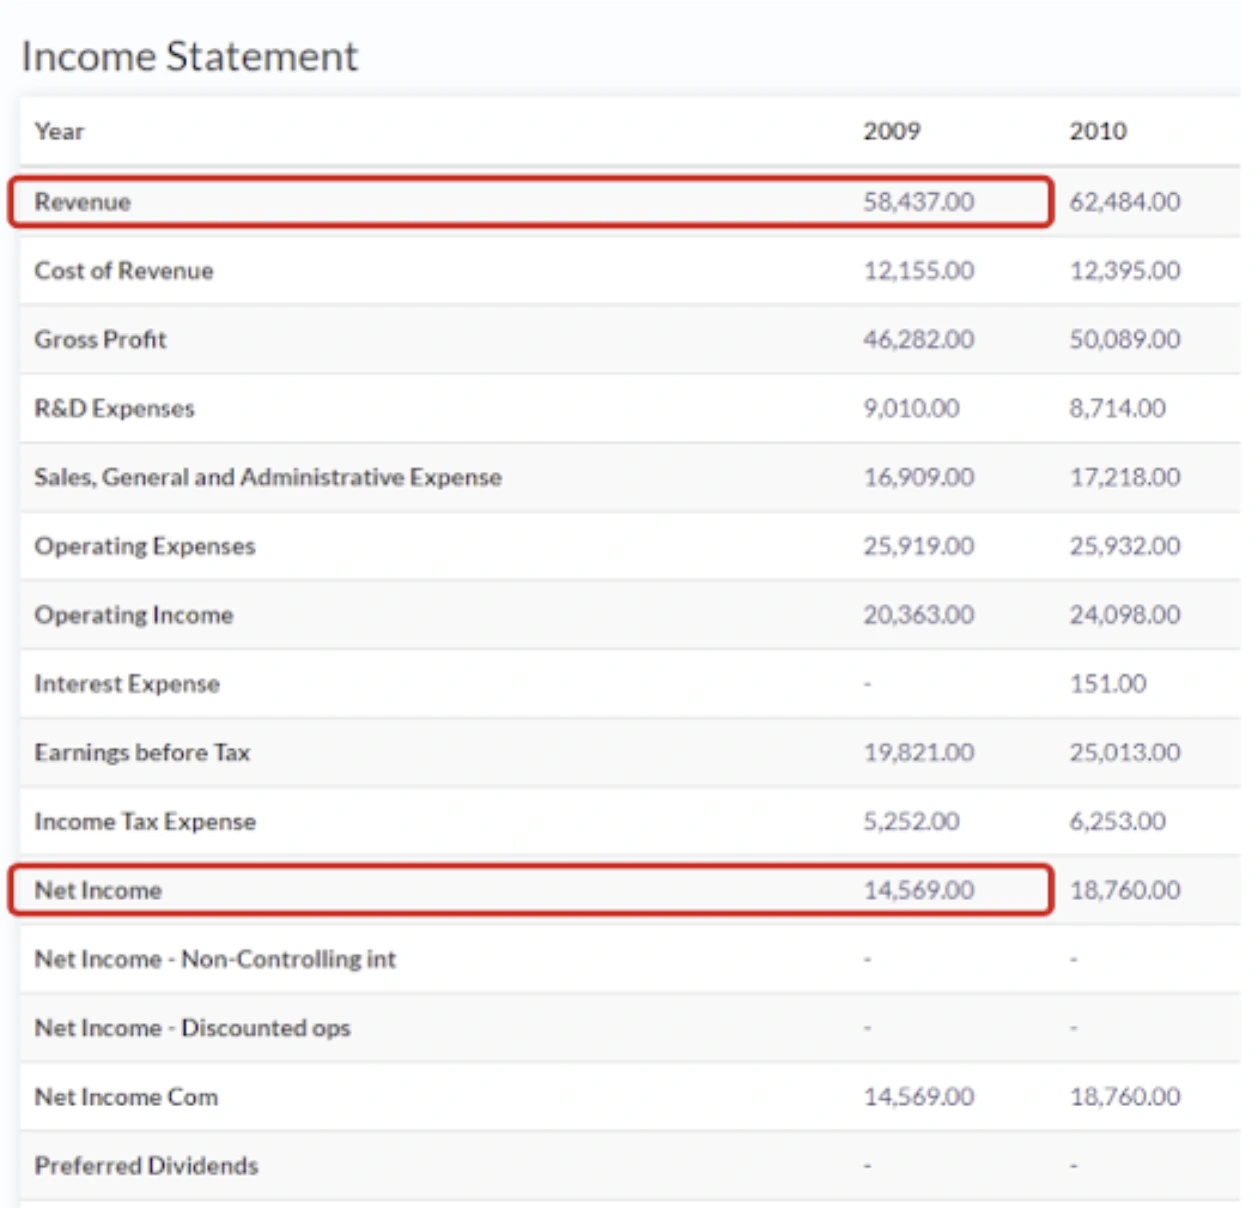
Net profit margin is the mother of all profitability ratios and the one most commonly used by analysts. It looks at the percentage of net income to revenue. Net income is calculated by subtracting all expenses (COGS, operating expenses, taxes, interest expense, and other expenses) from revenue. Whereas gross profit margin is good at seeing efficiency of production of goods/service delivery, net profit margin gives a greater insight into how the whole company is being run. Generally, a net profit margin in excess of 10% is considered excellent, though it depends on the industry and the structure of the business. ALWAYS LOOK AT INDUSTRY AVERAGES.
Equation: Net Profit Margin = Net Income / Revenue
5. Return on Assets (ROA)
Return on assets(ROA) gives an indication of the capital intensity of the company, which will depend on the industry; companies that require large initial investments will generally have lower return on assets. In simpler terms, ROA measures how well a company utilizes its assets to generate income. Given assets are invested capital, this ratio tells how much income was returned for that investment. ROAs over 5% are generally considered good, however, take with caution because ROAs vary significantly between industries.
Equation: ROA = Net Income / Average Total Assets
Equation: Average Total Assets = [Total Assets (Year=T) - Total Assets (Year=T-1)] / 2
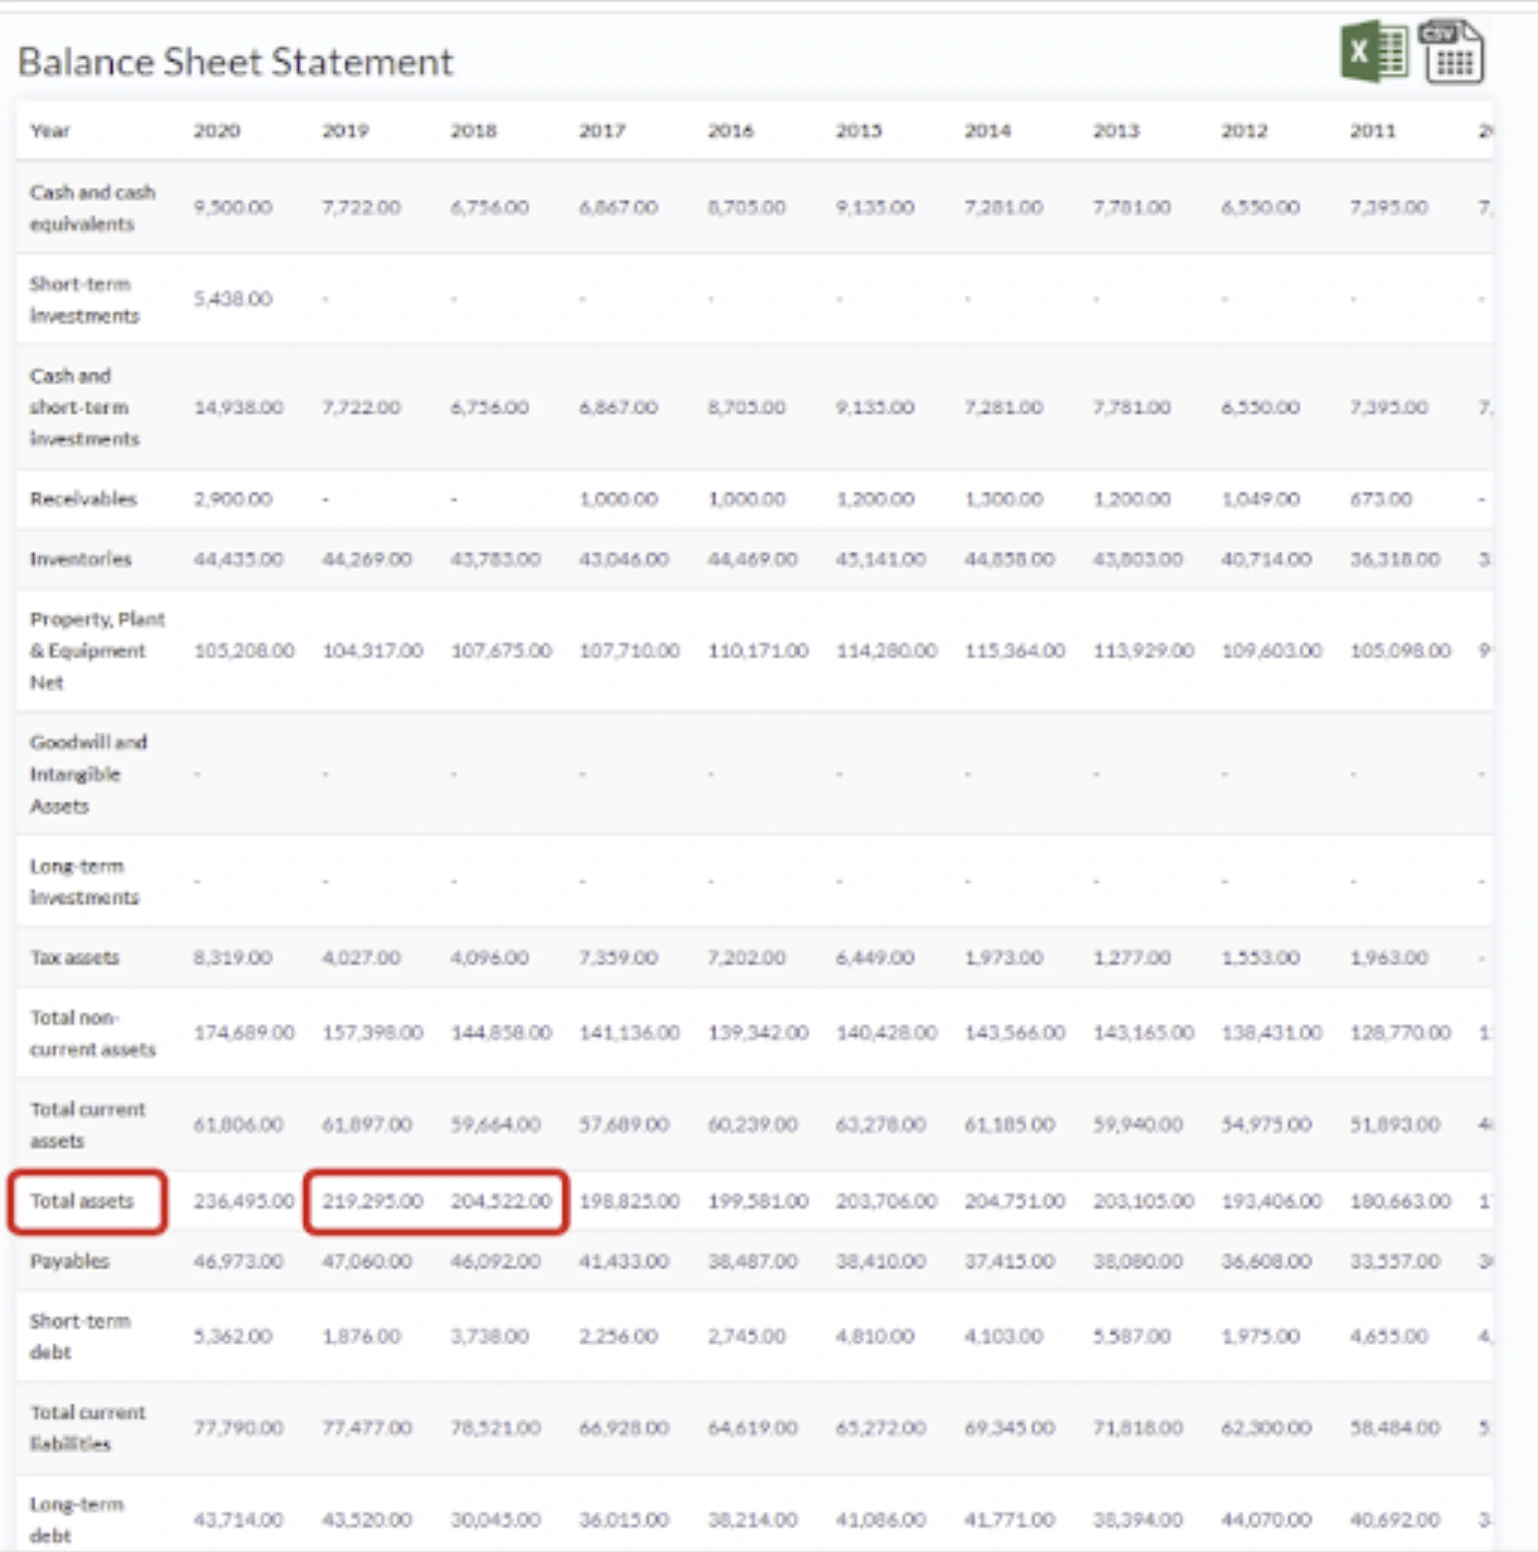
Where can I find these numbers? Net Income is found on the Income Statement as before and Total Assets are found on the Balance Sheet. Here's an example of where to find Total Assets using Walmart's Balance Sheet
6. Return on Equity (ROE)
ROE this ratio calculates how much money is made based on the investors' investment in the company. Investors want to see a high return on equity ratio because this indicates that the company is using its investors' funds effectively. Since Assets = Liabilities + Equity, ROE gives deeper insight into specifically how well the company generates profit in comparison to the value of the equity held; ROE is also considered the return on net assets because Equity = Assets - Liabilities. ROE has many uses beyond assessing a firm's profitability which we will go into another article.
Equation: ROE = Net Income / Average Total Equity
Equation: Average Total Equity = [Total Equity (Year=T) - Total Equity (Year=T-1)] / 2
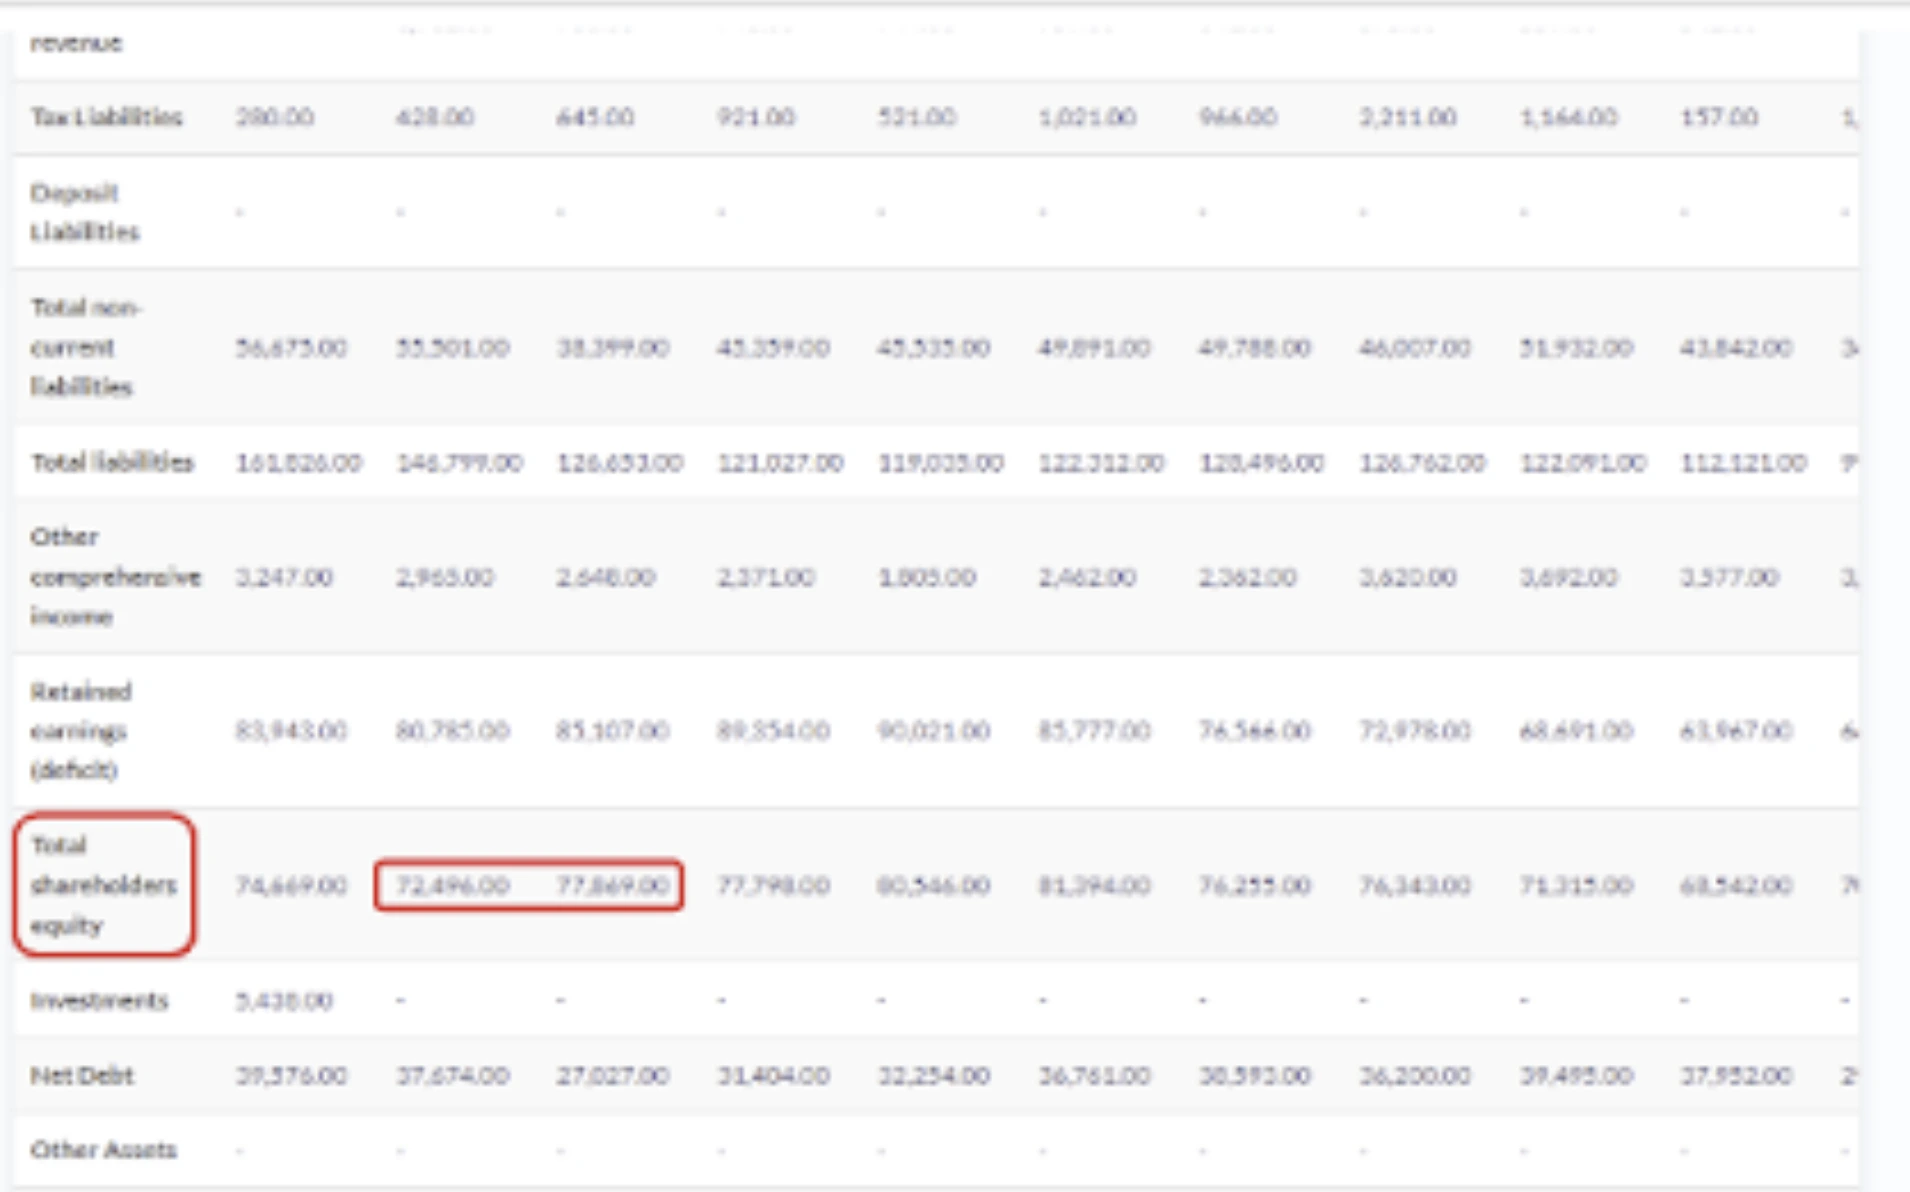
Where can I find these numbers? Net Income is found on the Income Statement as before and Total Assets are found on the Balance Sheet. Here's an example of where to find Total Equity (Total Shareholders Equity) using Walmart's Balance Sheet:
7. Return on Capital Employed (ROCE)
ROCE shows investors how many dollars in profits each dollar of capital employed generates. By doing so, it measures the profitability of a company and how well it employs its capital.This is particularly helpful when looking at a firm with heavy capital investments. What this means is that the company has a lot of assets and a lot of debt, such as resource companies or utilities. Unlike ROE, ROCE looks at debt and other liabilities as well as equity. What is of particular value is looking at the historic trend; investors like to see a ROCE that is stable and growing. Of course, compare ROCE calculations to other companies and the industry average.
Equation: ROCE=EBIT(Average Total Assets - Average Current Liabilities)
Equation: Average Total Assets = [Total Assets (Year=T) - Total Assets (Year=T-1)] / 2
Equation: Average Current Liabilities = [Current Liabilities (Year=T)-Current Liabilities (Year=T-1)] / 2
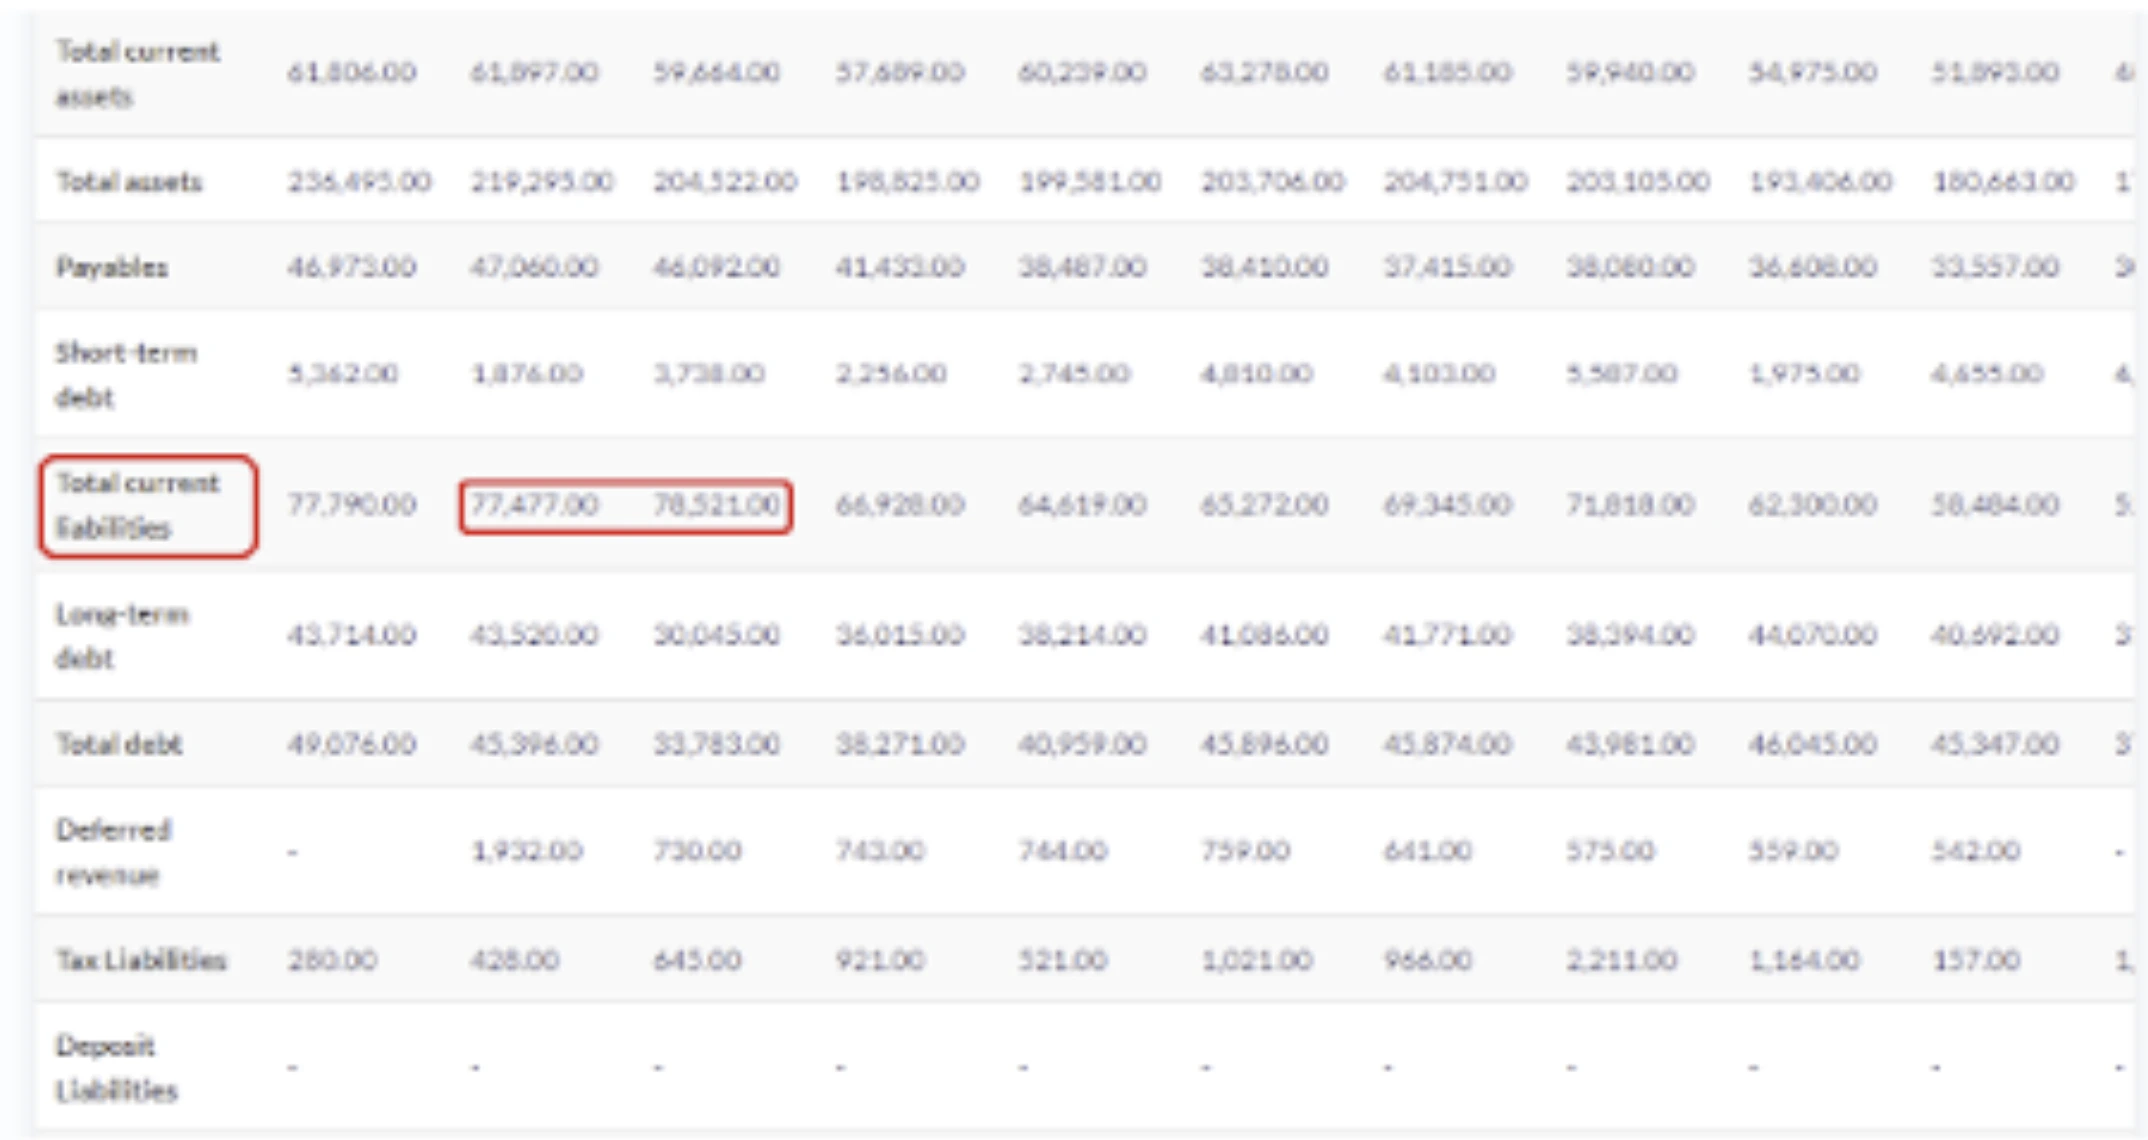
Where can I find these numbers? Net Income is found on the Income Statement as before and Total Assets are found on the Balance Sheet. Here's an example of where to find Current Liabilities using Walmart's Balance Sheet:
Rounding Up
The profitability ratios we discussed in this article will enable you to learn how efficient a company is in creating revenues and hence more profit. Financial Modeling prep gives you the most up to date ratios for all listed companies but more importantly gives you access to downloadable financial statements so you can perform your own calculations. We recommend downloading a few financial statements from some companies you are interested in and calculating their profitability ratios. Here is a link to Tesla Financial Statements to get you going!
Other Blogs
Sep 11, 2023 1:38 PM - Rajnish Katharotiya
P/E Ratios Using Normalized Earnings
Price to Earnings is one of the key metrics use to value companies using multiples. The P/E ratio and other multiples are relative valuation metrics and they cannot be looked at in isolation. One of the problems with the P/E metric is the fact that if we are in the peak of a business cycle, earni...

Sep 11, 2023 1:49 PM - Rajnish Katharotiya
What is Price To Earnings Ratio and How to Calculate it using Python
Price-to-Earnings ratio is a relative valuation tool. It is used by investors to find great companies at low prices. In this post, we will build a Python script to calculate Price Earnings Ratio for comparable companies. Photo by Skitterphoto on Pexels Price Earnings Ratio and Comparable Compa...

Oct 17, 2023 3:09 PM - Davit Kirakosyan
VMware Stock Drops 12% as China May Hold Up the Broadcom Acquisition
Shares of VMware (NYSE:VMW) witnessed a sharp drop of 12% intra-day today due to rising concerns about China's review of the company's significant sale deal to Broadcom. Consequently, Broadcom's shares also saw a dip of around 4%. Even though there aren’t any apparent problems with the proposed solu...