FMP
Learn Financial Modeling : Discounted Cash Flow statement (DCF) Methodology
Sep 30, 2022 5:10 AM - Jack Dalton


Image credit: John Schnobrich
3. Find our Terminal Value
The terminal value (TV) of an asset, business, or project is the value of the asset, business, or project after the forecasted period when future cash flows can be estimated. Terminal value assumes that a company will continue to grow at a constant rate after the forecast period. The terminal value frequently accounts for a sizable portion of the total assessed value.
Forecasting value becomes more difficult as one looks further into the future. This is especially true when it comes to something as volatile as cash flow. However, it is critical to value businesses and assets as efficiently as possible, which is why financial models such as discounted cash flow are used to determine the total value of a project/business.
There are two methods used for terminal value calculations: The first is the perpetual growth method, which we will use. The perpetual growth method is based on the assumption that the growth rate of free cash flows in the final year of the initial forecast period will continue in perpetuity.
The second method is the multiple exit method. The multiple exit methods are predicated on assuming that a business will be sold after the projection period. To arrive at a terminal value, we will use the perpetual growth method.
A terminal value is presumptively present in year 5. We will use the discount factor for year 5 to arrive at the present value of the terminal value. Let us proceed to calculate the terminal value now that we know what it is. We multiply the UFCF value from the forecasted year fivefold by one and add the long-term growth rate.
This calculation yields the value of the free cash flow (t+1). We will calculate the Weighted Average Cost of Capital (WACC) later, but to arrive at the terminal value, we would divide Free cash flow (t+1) by WACC minus the long-term growth rate.
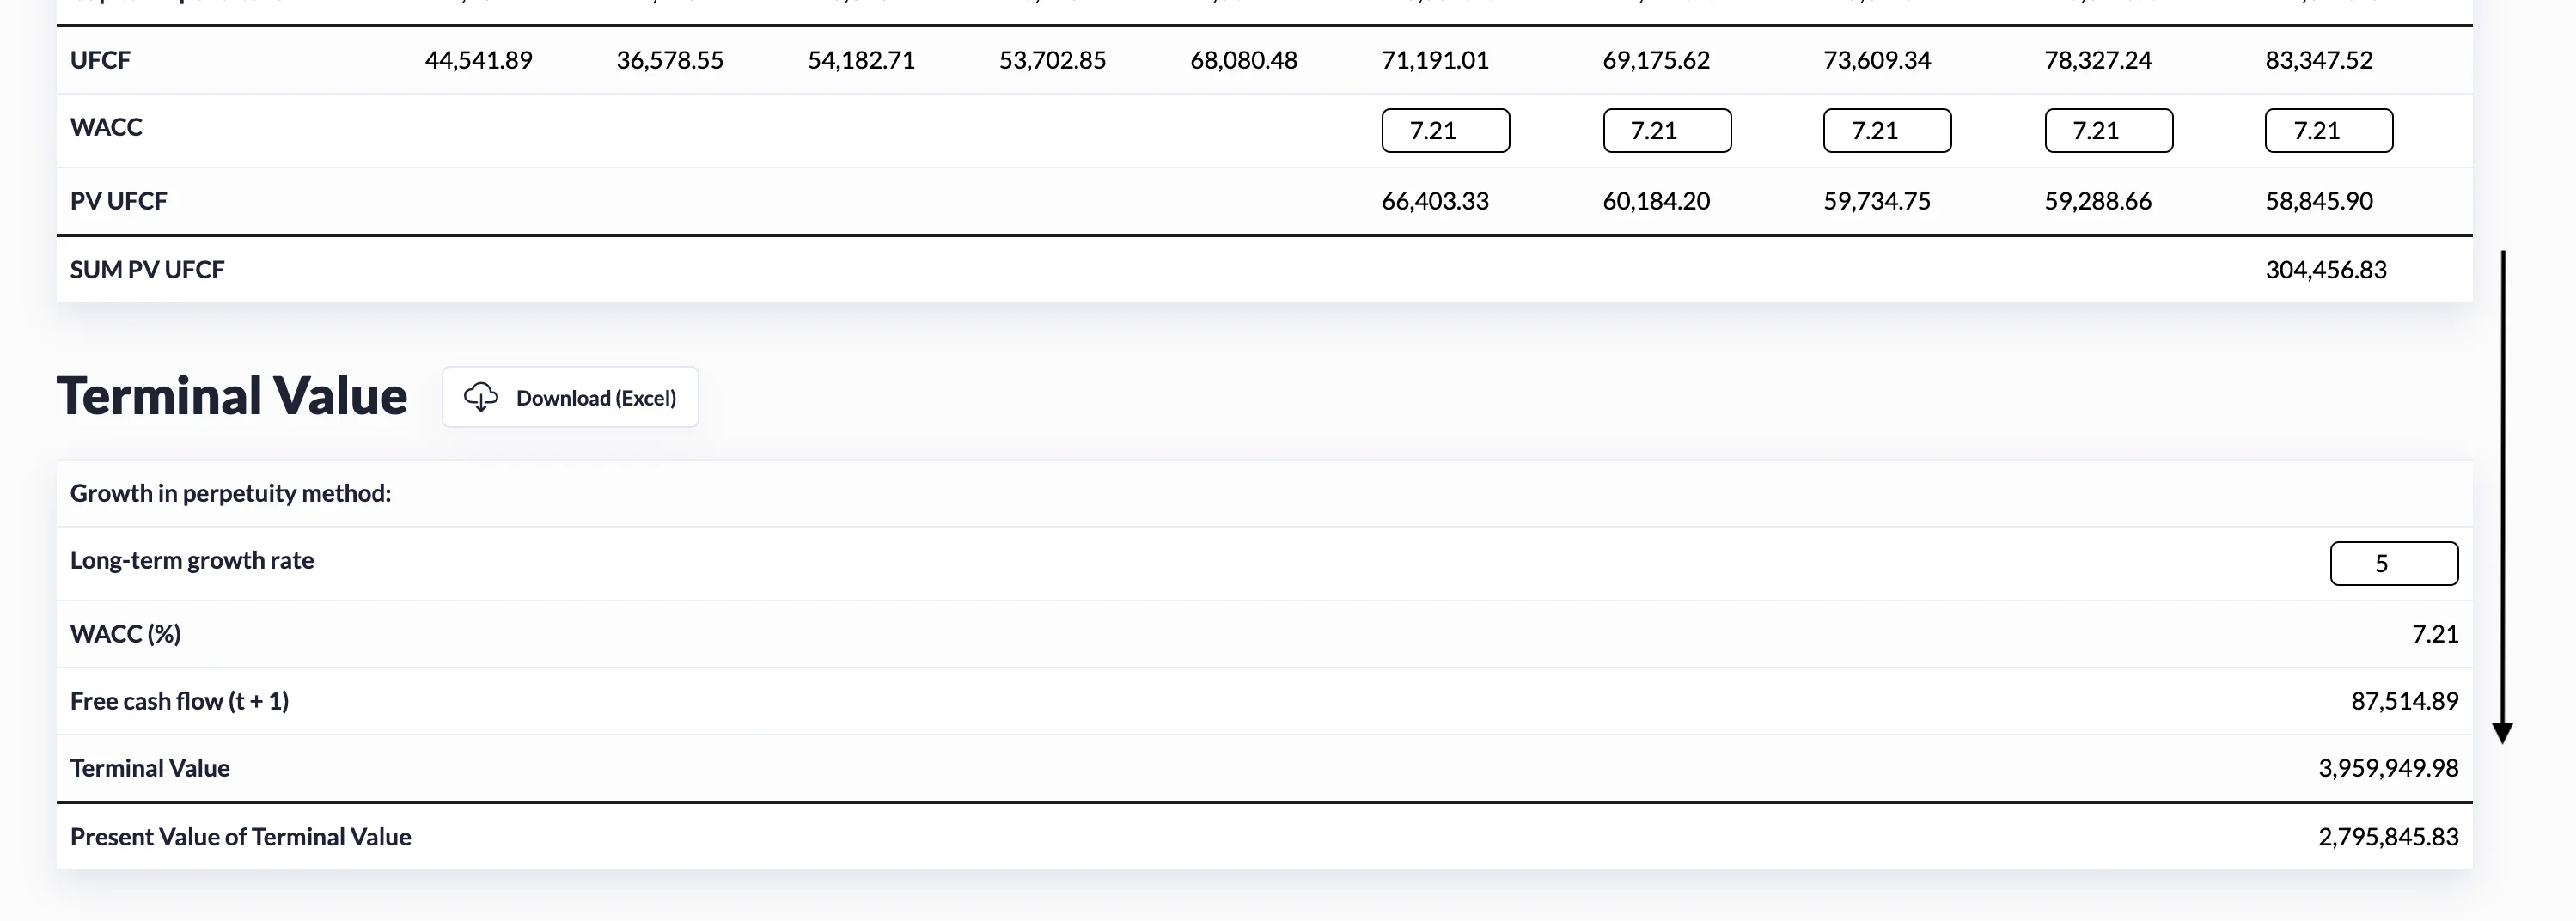
Then, we divide the terminal value by 1 plus WACC raised to the fifth power to obtain the present value of terminal value.
In summary, we forecasted free cash flows from the present to the future to arrive at the present value of what we refer to as stage 1.
Then, using the perpetual growth method, we calculated the value beyond the explicit forecast periods. Then we discount that value to the present to obtain the terminal value's present value, which is the stage 2 value.
Next, we will learn how to calculate the WACC value; the only remaining factor we need to complete is the present values of the free cash flows and fill all the missing info in our DCF analysis. Go to weighted average cost of capital
Other Blogs
Sep 11, 2023 1:38 PM - Rajnish Katharotiya
P/E Ratios Using Normalized Earnings
Price to Earnings is one of the key metrics use to value companies using multiples. The P/E ratio and other multiples are relative valuation metrics and they cannot be looked at in isolation. One of the problems with the P/E metric is the fact that if we are in the peak of a business cycle, earni...

Sep 11, 2023 1:49 PM - Rajnish Katharotiya
What is Price To Earnings Ratio and How to Calculate it using Python
Price-to-Earnings ratio is a relative valuation tool. It is used by investors to find great companies at low prices. In this post, we will build a Python script to calculate Price Earnings Ratio for comparable companies. Photo by Skitterphoto on Pexels Price Earnings Ratio and Comparable Compa...

Oct 17, 2023 3:09 PM - Davit Kirakosyan
VMware Stock Drops 12% as China May Hold Up the Broadcom Acquisition
Shares of VMware (NYSE:VMW) witnessed a sharp drop of 12% intra-day today due to rising concerns about China's review of the company's significant sale deal to Broadcom. Consequently, Broadcom's shares also saw a dip of around 4%. Even though there aren’t any apparent problems with the proposed solu...